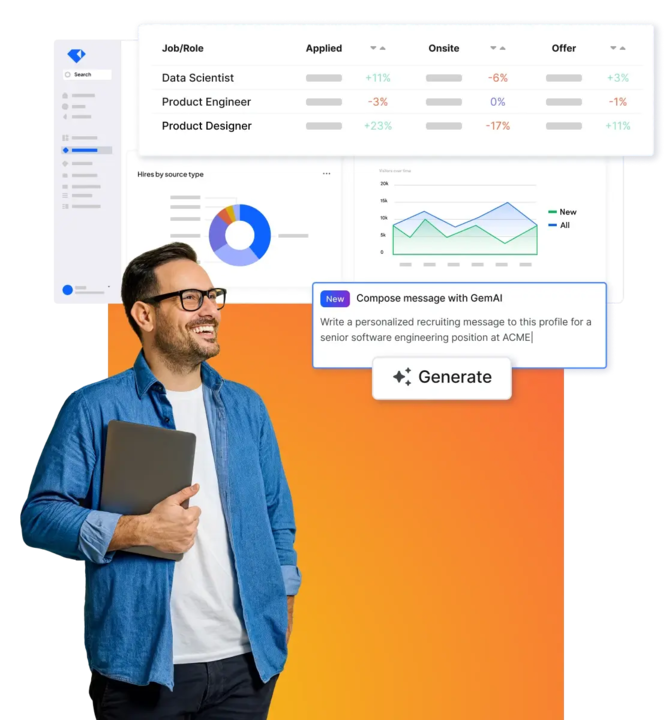

We’ve combed through data from over 140 million applications, 14 million candidates, and 1 million hires to identify the key trends shaping the recruiting industry in 2025. We’ll share a few highlights here, but you can download the full 2025 Recruiting Benchmarks Report for more details, like segment-specific slices by industry, company size, location, and department.
The recruiting landscape has undergone significant changes in recent years, making benchmarking crucial for companies to stay competitive. From the pandemic's disruption to the Great Resignation and economic shifts, recruiters have had to adapt rapidly.
Gem’s fifth annual Recruiting Benchmarks report provides insights into hiring trends, application volumes, team workloads, source channel metrics, and candidate passthrough rates. Based on data from January 2021 to December 2024, covering over 140 million applicants and 1.3 million hires, this report helps talent leaders compare their performance to industry averages and refine their strategies.
Here are the top 10 takeaways from the report:
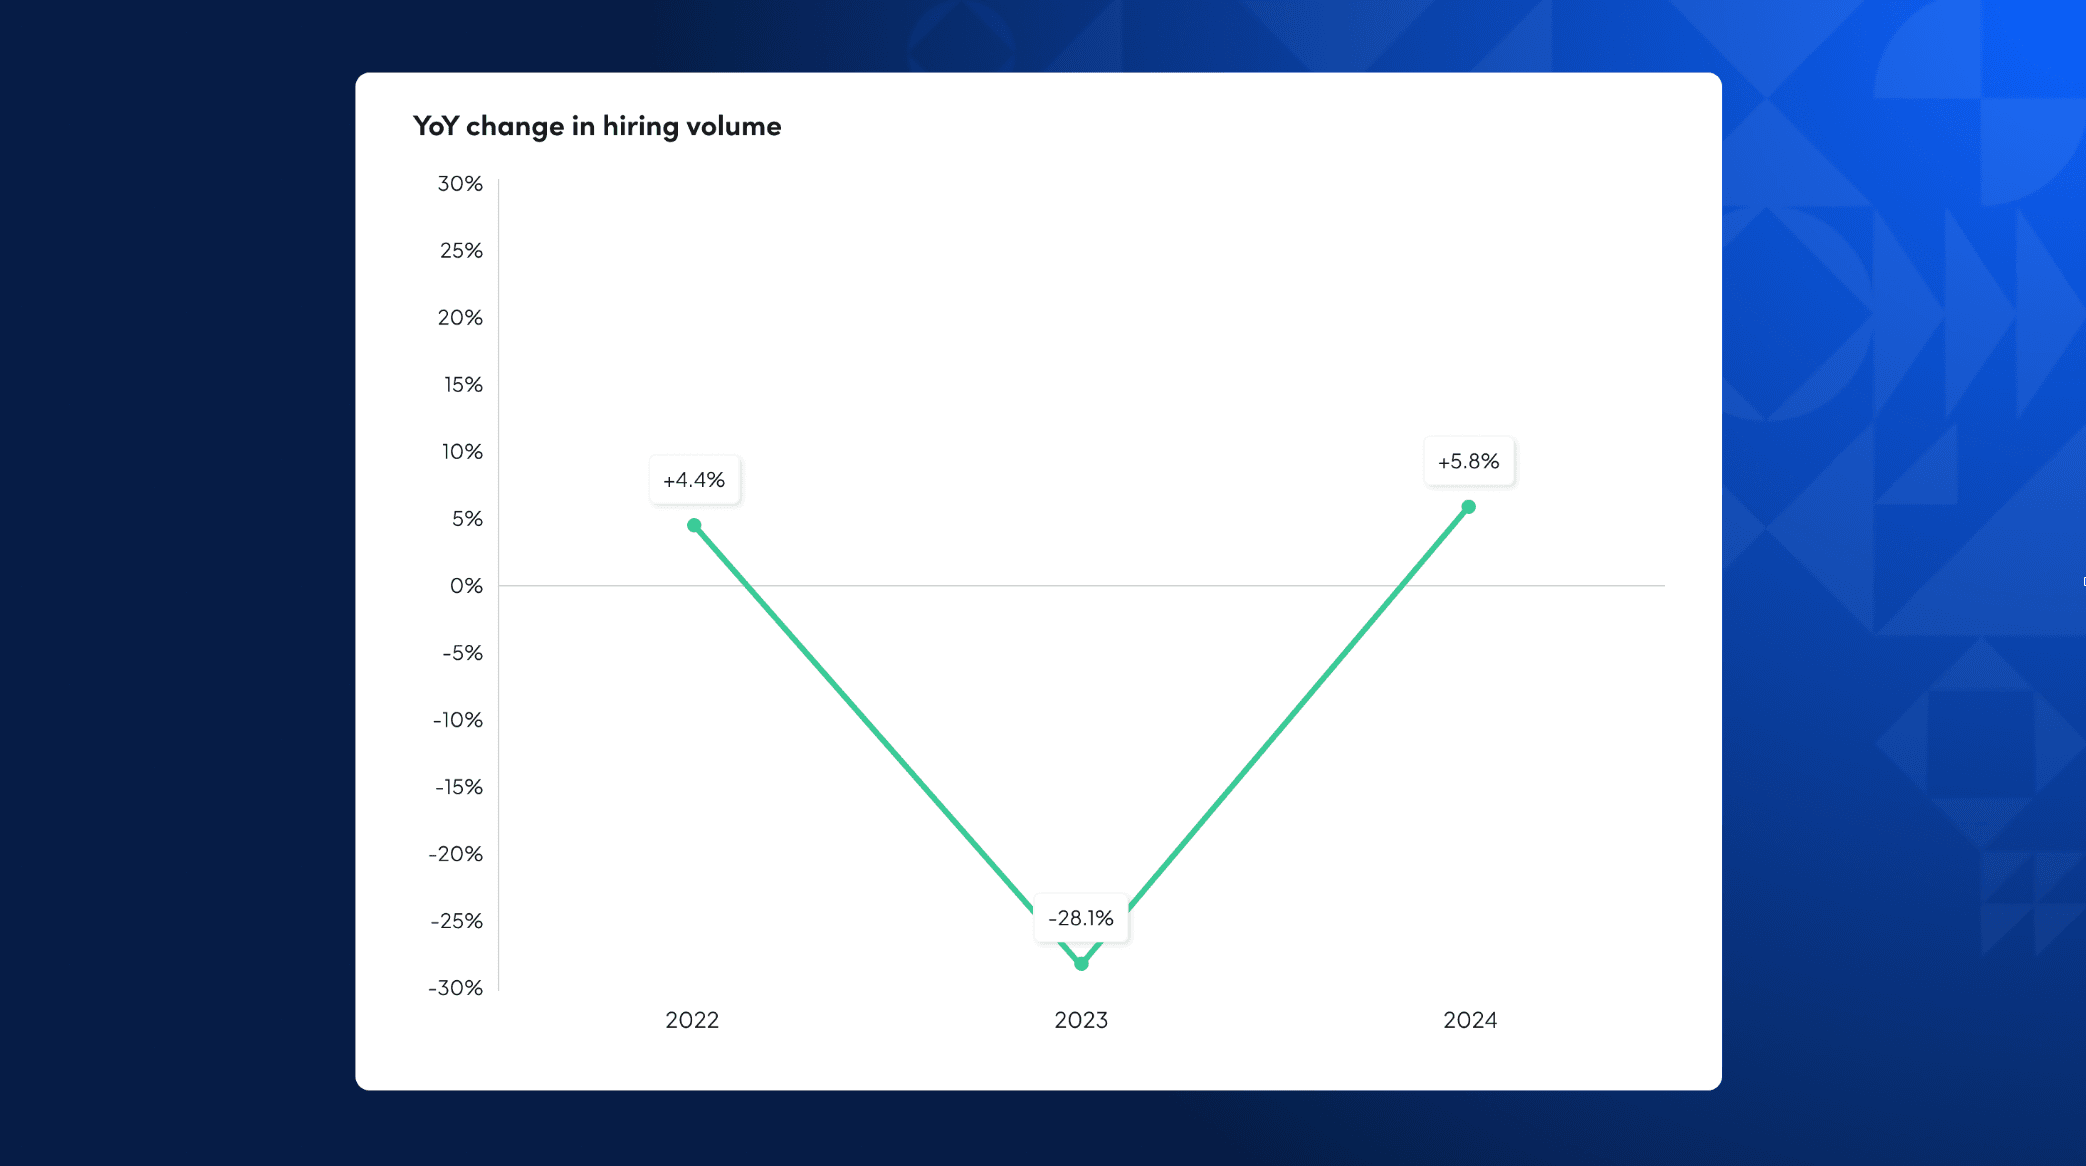
1. Hiring is finally starting to come back with a modest rebound.
After a steep decline in 2023 (28.1% YoY), hiring growth rebounded in 2024 (+5.8% YoY). Smaller companies (<500 FTE) saw the most significant relative increase in 2024, indicating their agility in adapting to market shifts. Mid-sized organizations also showed steady recovery, though slower than their smaller counterparts. This growth suggests renewed confidence in hiring as economic conditions stabilize and businesses refocus on expansion. For many, this rebound highlights the importance of strategic talent acquisition to remain competitive in a changing landscape.
2. Recruiting teams are leaner than ever before.
The average recruiter headcount per team has noticeably declined from 31 in 2022 to 24 in 2024. In other words, team resources were still shrinking in 2024 despite a resurgence in hiring activity. This trend emphasizes the growing need for recruiting tools that make lean teams more efficient and help them manage higher workloads without sacrificing quality.
![Recruiting team size [aggregate] chart](/_next/image?url=https%3A%2F%2Fimages.ctfassets.net%2Fwyze6bs9tw5d%2F60S9a8MyJUfVLijI8aYL6y%2Fefcbf57522116f076ef11b4fef164cf7%2FBlog_image_2.png&w=3840&q=75)
3. Doing more with less is not just a tagline, it’s a reality.
The average recruiter manages 56% more open job reqs (14) and 2.7× more applications (2,500+) than three years ago. AI and automation are key investments for teams looking to avoid burnout. These tools streamline repetitive tasks and enable recruiters to focus on higher-value activities like candidate engagement. As workloads continue to grow, utilizing more technology is no longer optional—it's critical for sustaining productivity and maintaining a positive candidate experience.
![Job reqs per recruiter [aggregate] chart + Applications per recruiter [aggregate] chart](/_next/image?url=https%3A%2F%2Fimages.ctfassets.net%2Fwyze6bs9tw5d%2F5Tjfmmsh62G0eENVCkXbaa%2Fe4febb33c00e4d4a457b1b433fdb97ae%2FBlog_Image_3.png&w=3840&q=75)
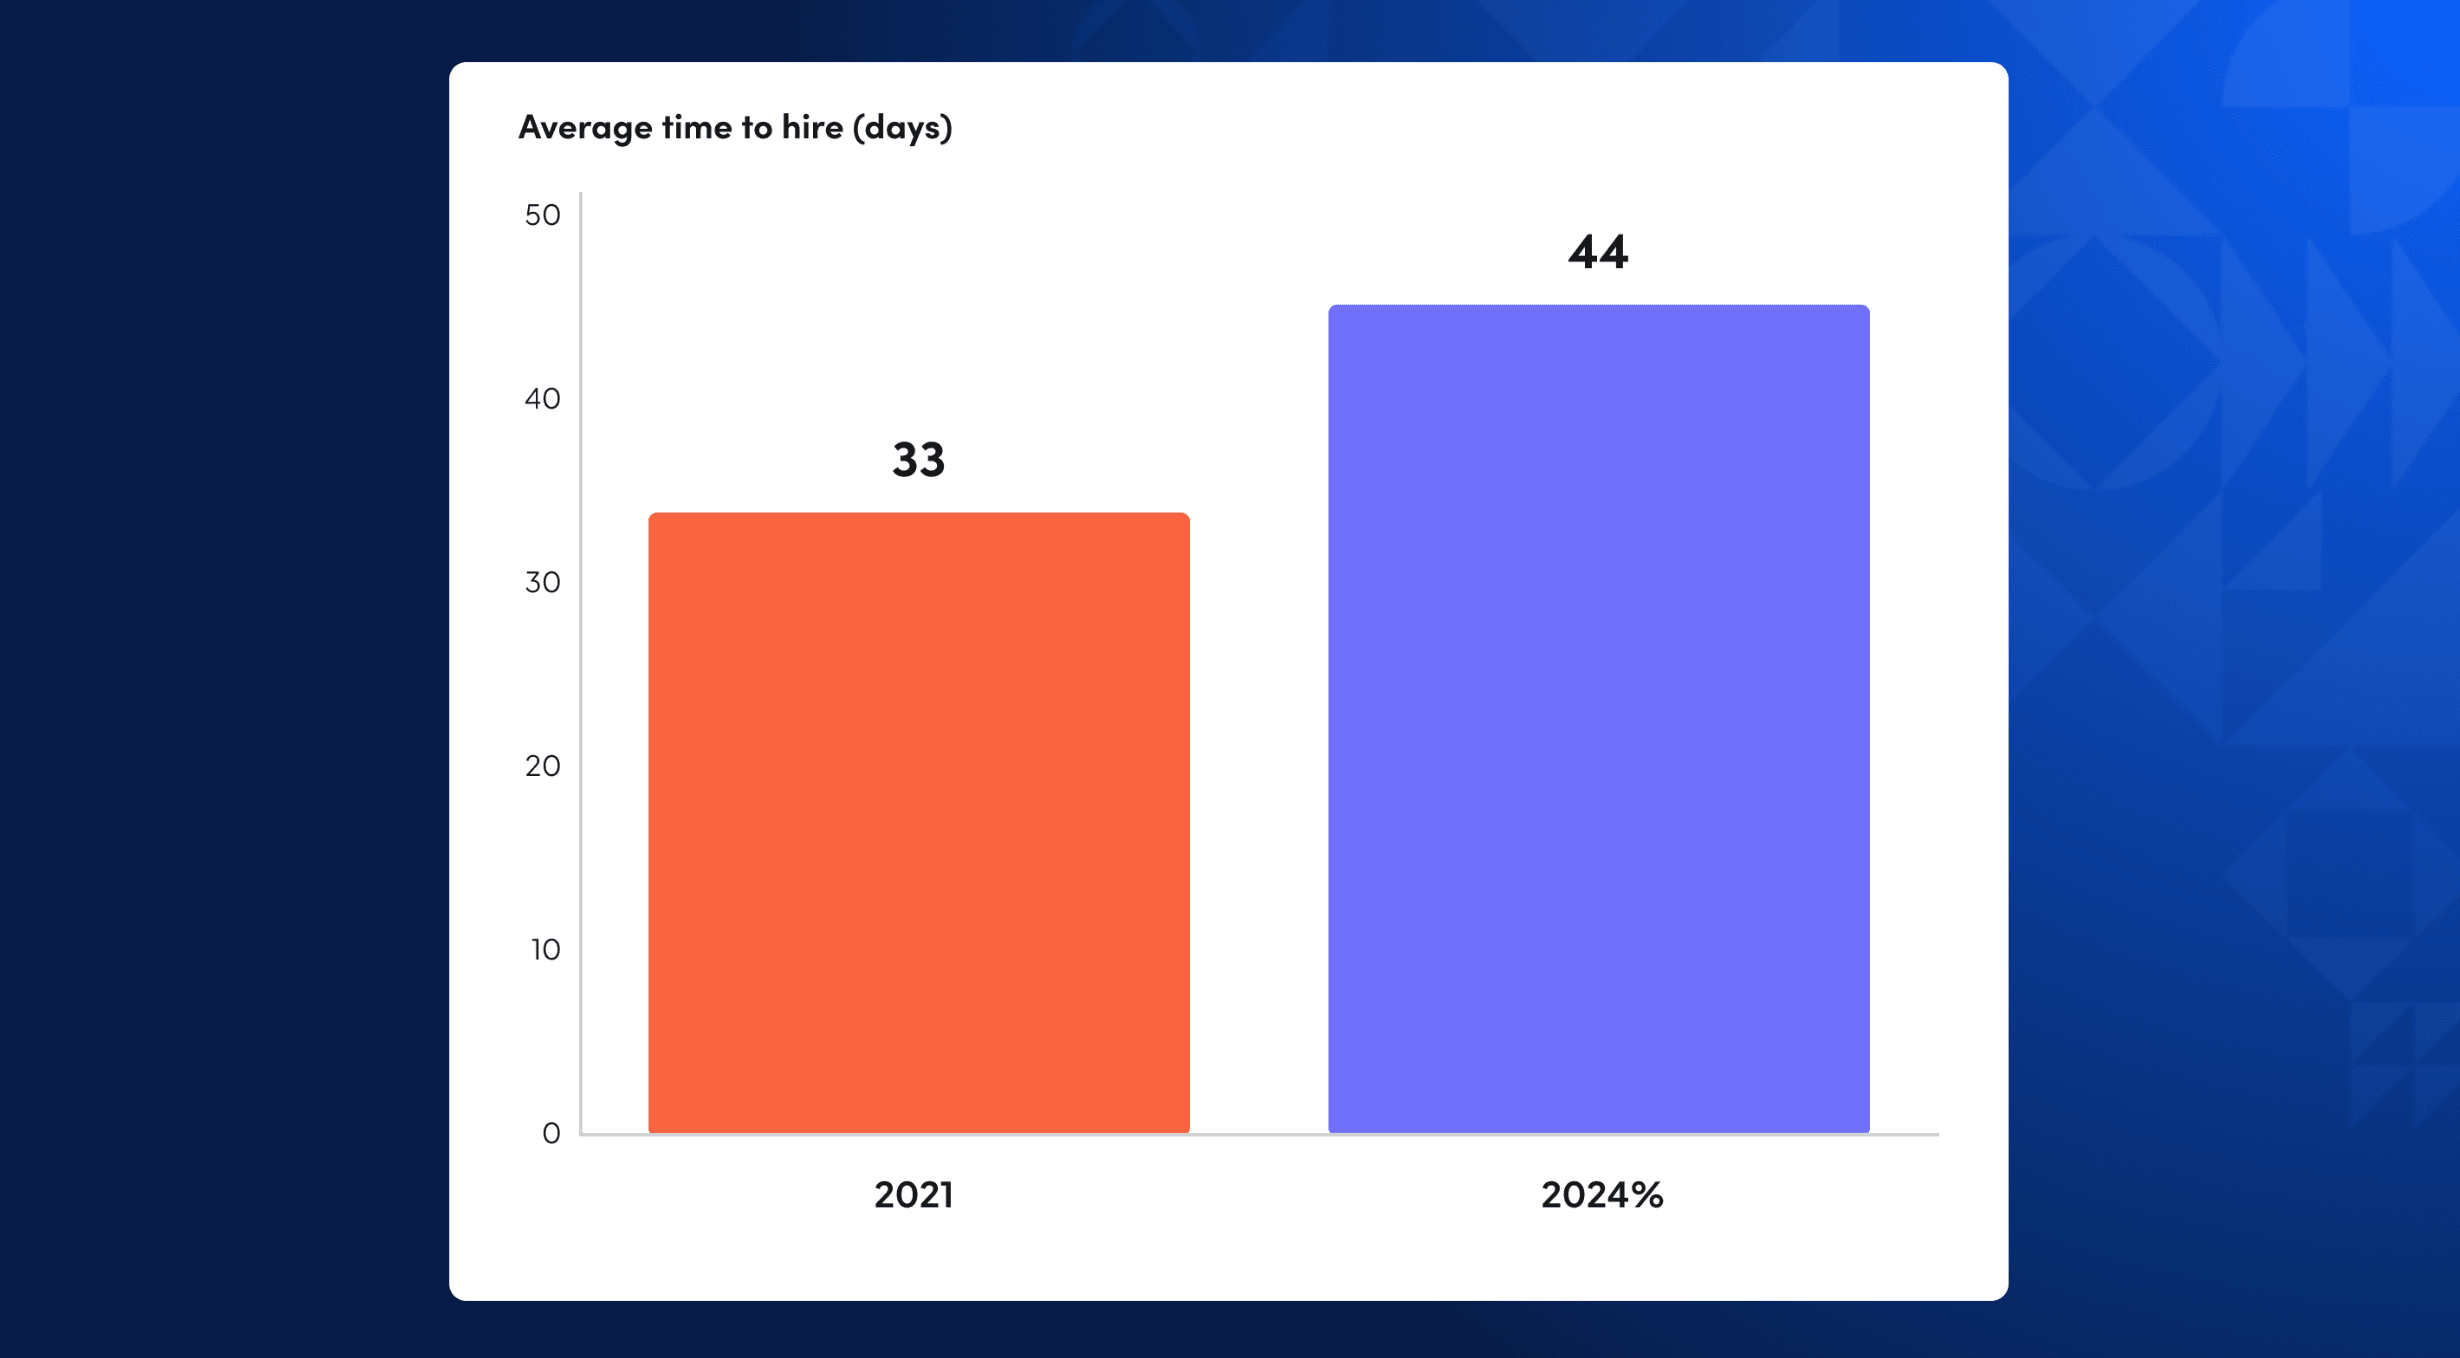
4. Teams are taking longer to hire with more interviews.
Hiring teams conduct 42% more interviews per hire than in 2021 (20 vs. 14), contributing to a 24% increase in average time to hire (41 vs. 33 days). With more interviews comes more time. This makes managing candidate relationships more crucial than ever, as prolonged processes risk disengaging top talent. Building trust and maintaining strong communication throughout the hiring journey keeps candidates invested and prevents losing them to faster-moving competitors.
5 . Post-and-pray is popular, yet inefficient.
Job boards and social sites dominate the application pool, accounting for nearly half (49.0%) of all applications. Yet, they contribute less than a quarter (24.6%) of actual hires. This discrepancy highlights the need for recruiting teams to evaluate the effectiveness of their sourcing channels critically. Investing in higher-converting sources, such as employee referrals or direct sourcing, can lead to better outcomes and a more efficient hiring process.
![% of applications by source [aggregate] chart + % of hires by source [aggregate] chart](/_next/image?url=https%3A%2F%2Fimages.ctfassets.net%2Fwyze6bs9tw5d%2F3r2G8nc6cLCgY2WZRejpid%2Fafe905bdba4ca030f571f84d592c9147%2FScreenshot_2025-01-19_at_3.23.21_PM.png&w=3840&q=75)
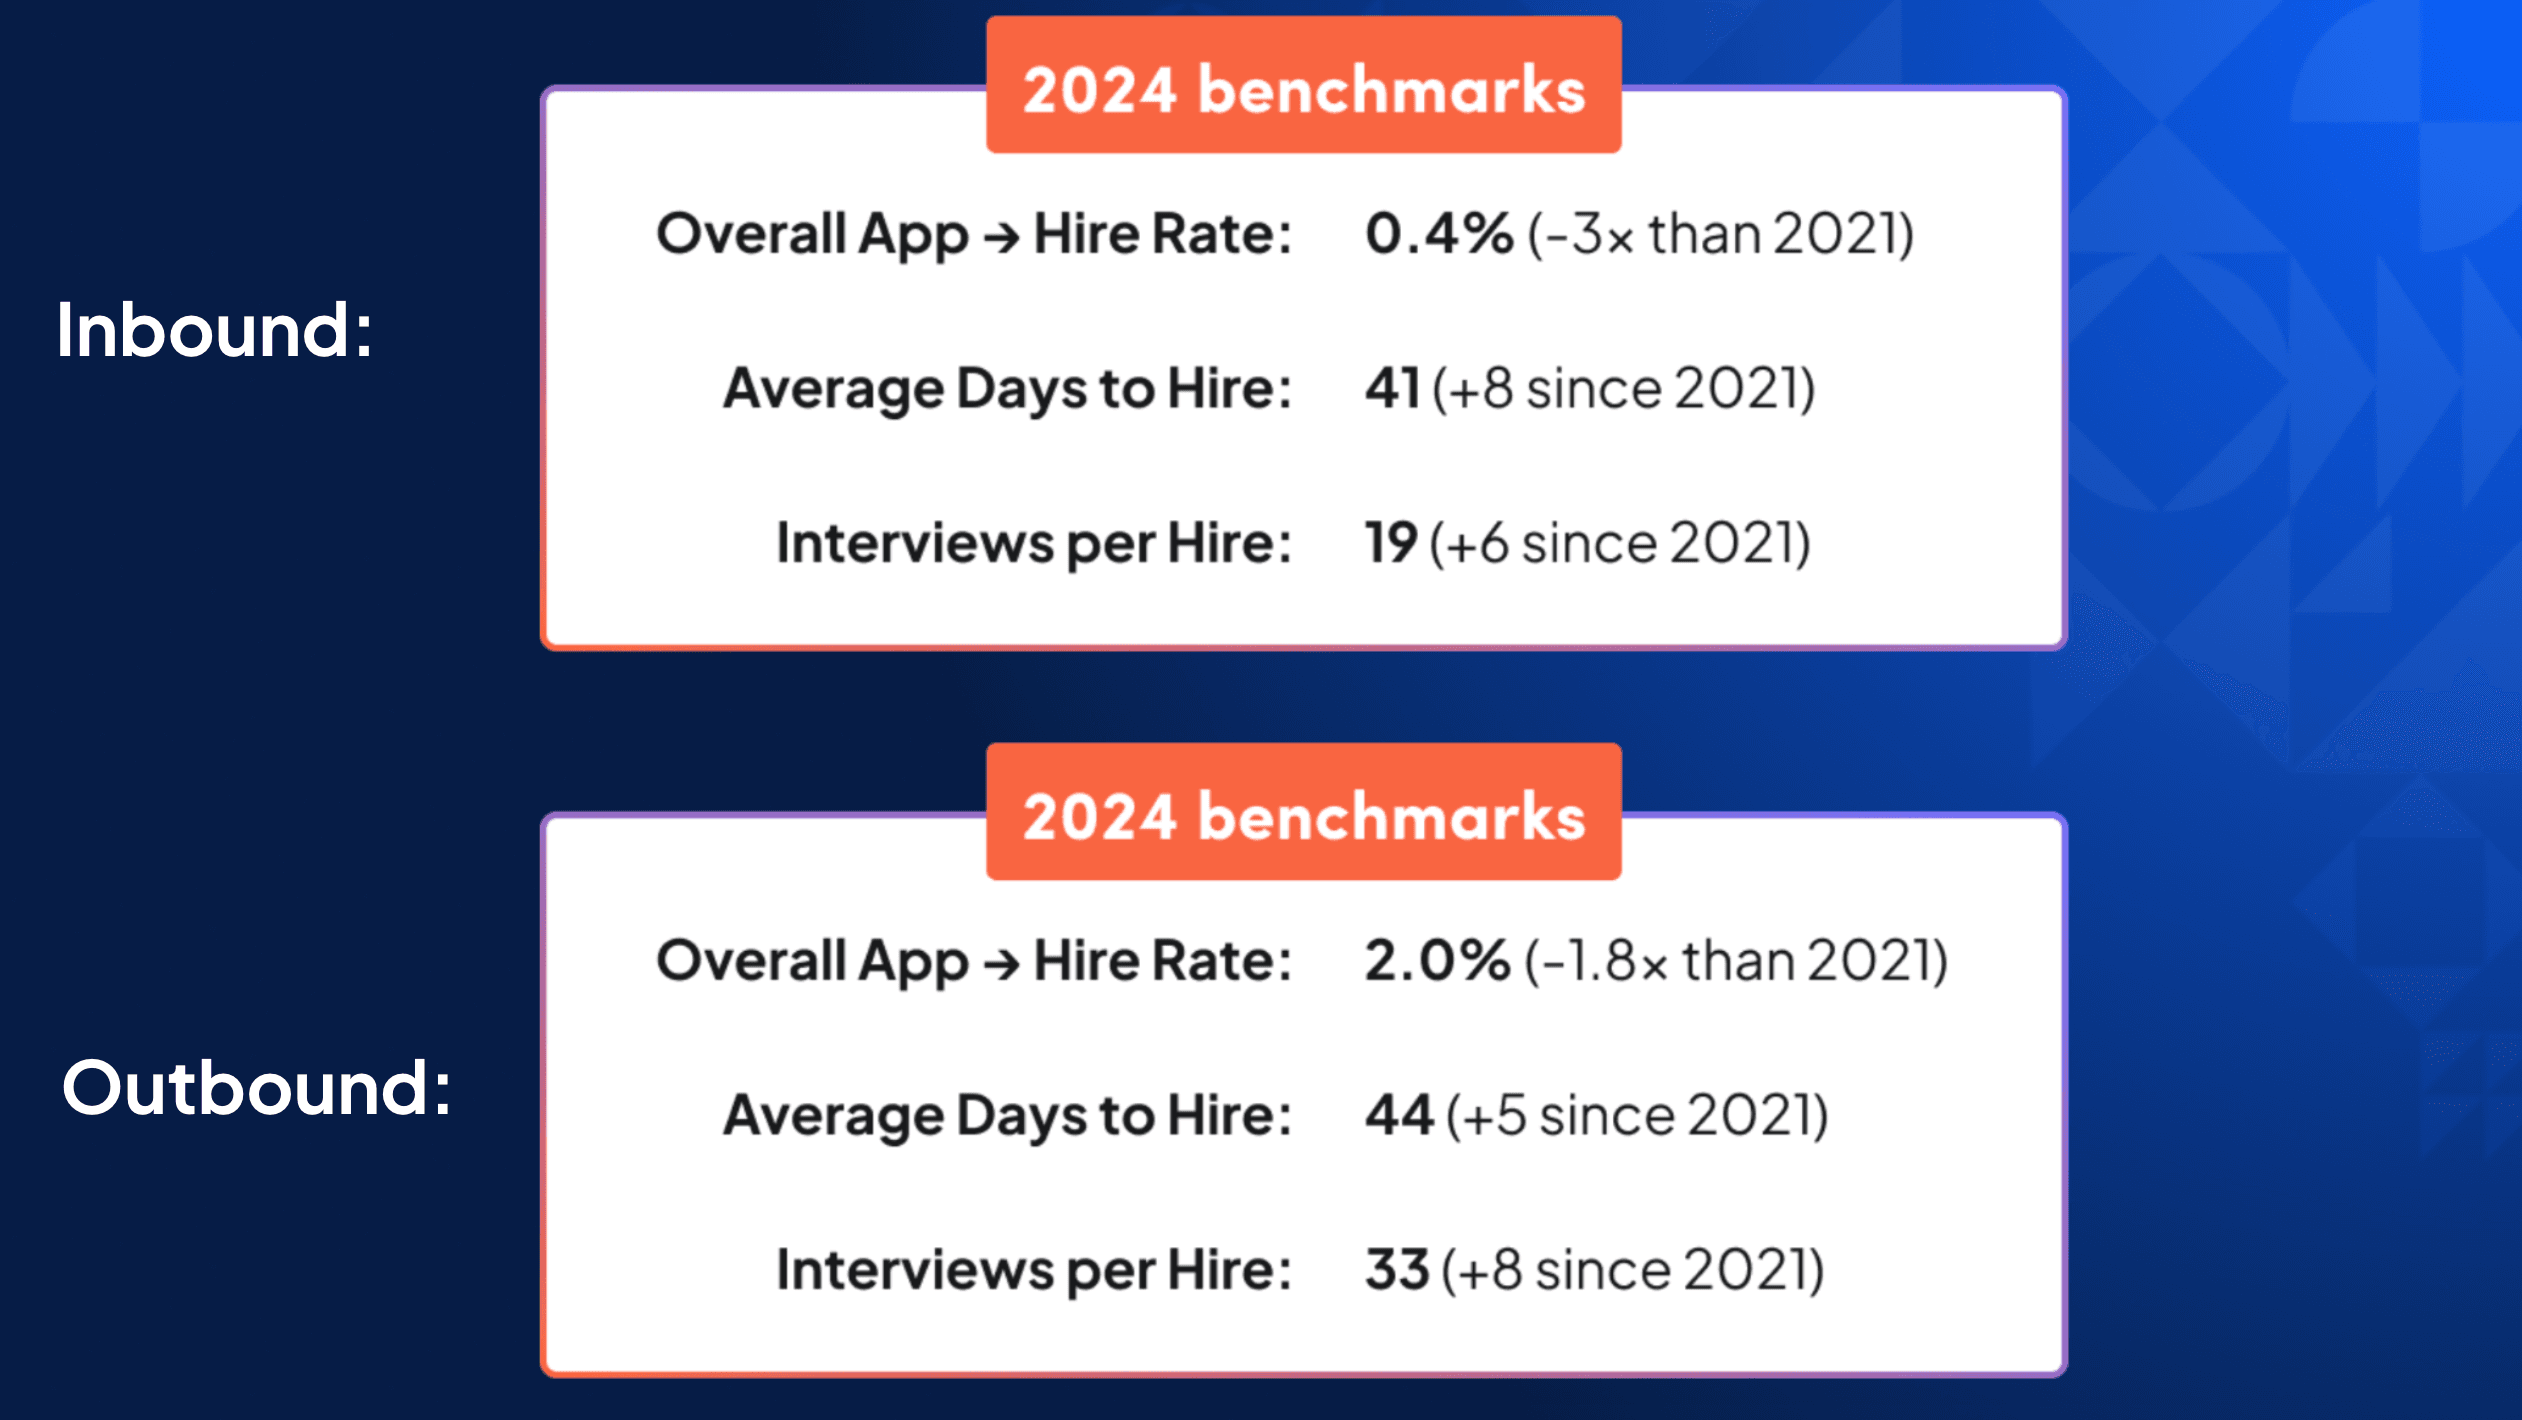
6. Sourcing continues to attract the best talent.
A sourced (outbound) applicant is 5× more likely to be hired than an inbound applicant, demonstrating that sourcing talent is one of the most efficient strategies for hiring top-tier talent. This underscores the value of proactive outreach and personalized engagement in attracting high-quality candidates. As competition for top talent intensifies, building strong pipelines through sourcing is critical to maintaining a competitive edge.
7. Talent rediscovery is the key to building deep, qualified pipelines.
The proportion of sourced hires that are rediscovered within companies’ CRM or ATS has shown a clear upward trend, rising from 29.1% in 2021 to 44.0% in 2024. Instead of paying for a job ad, hiring an agency, or starting a search from scratch, talent teams can accelerate hiring by starting their search within their existing database. This approach saves time and resources and ensures candidates who are already familiar with the company are re-engaged effectively.
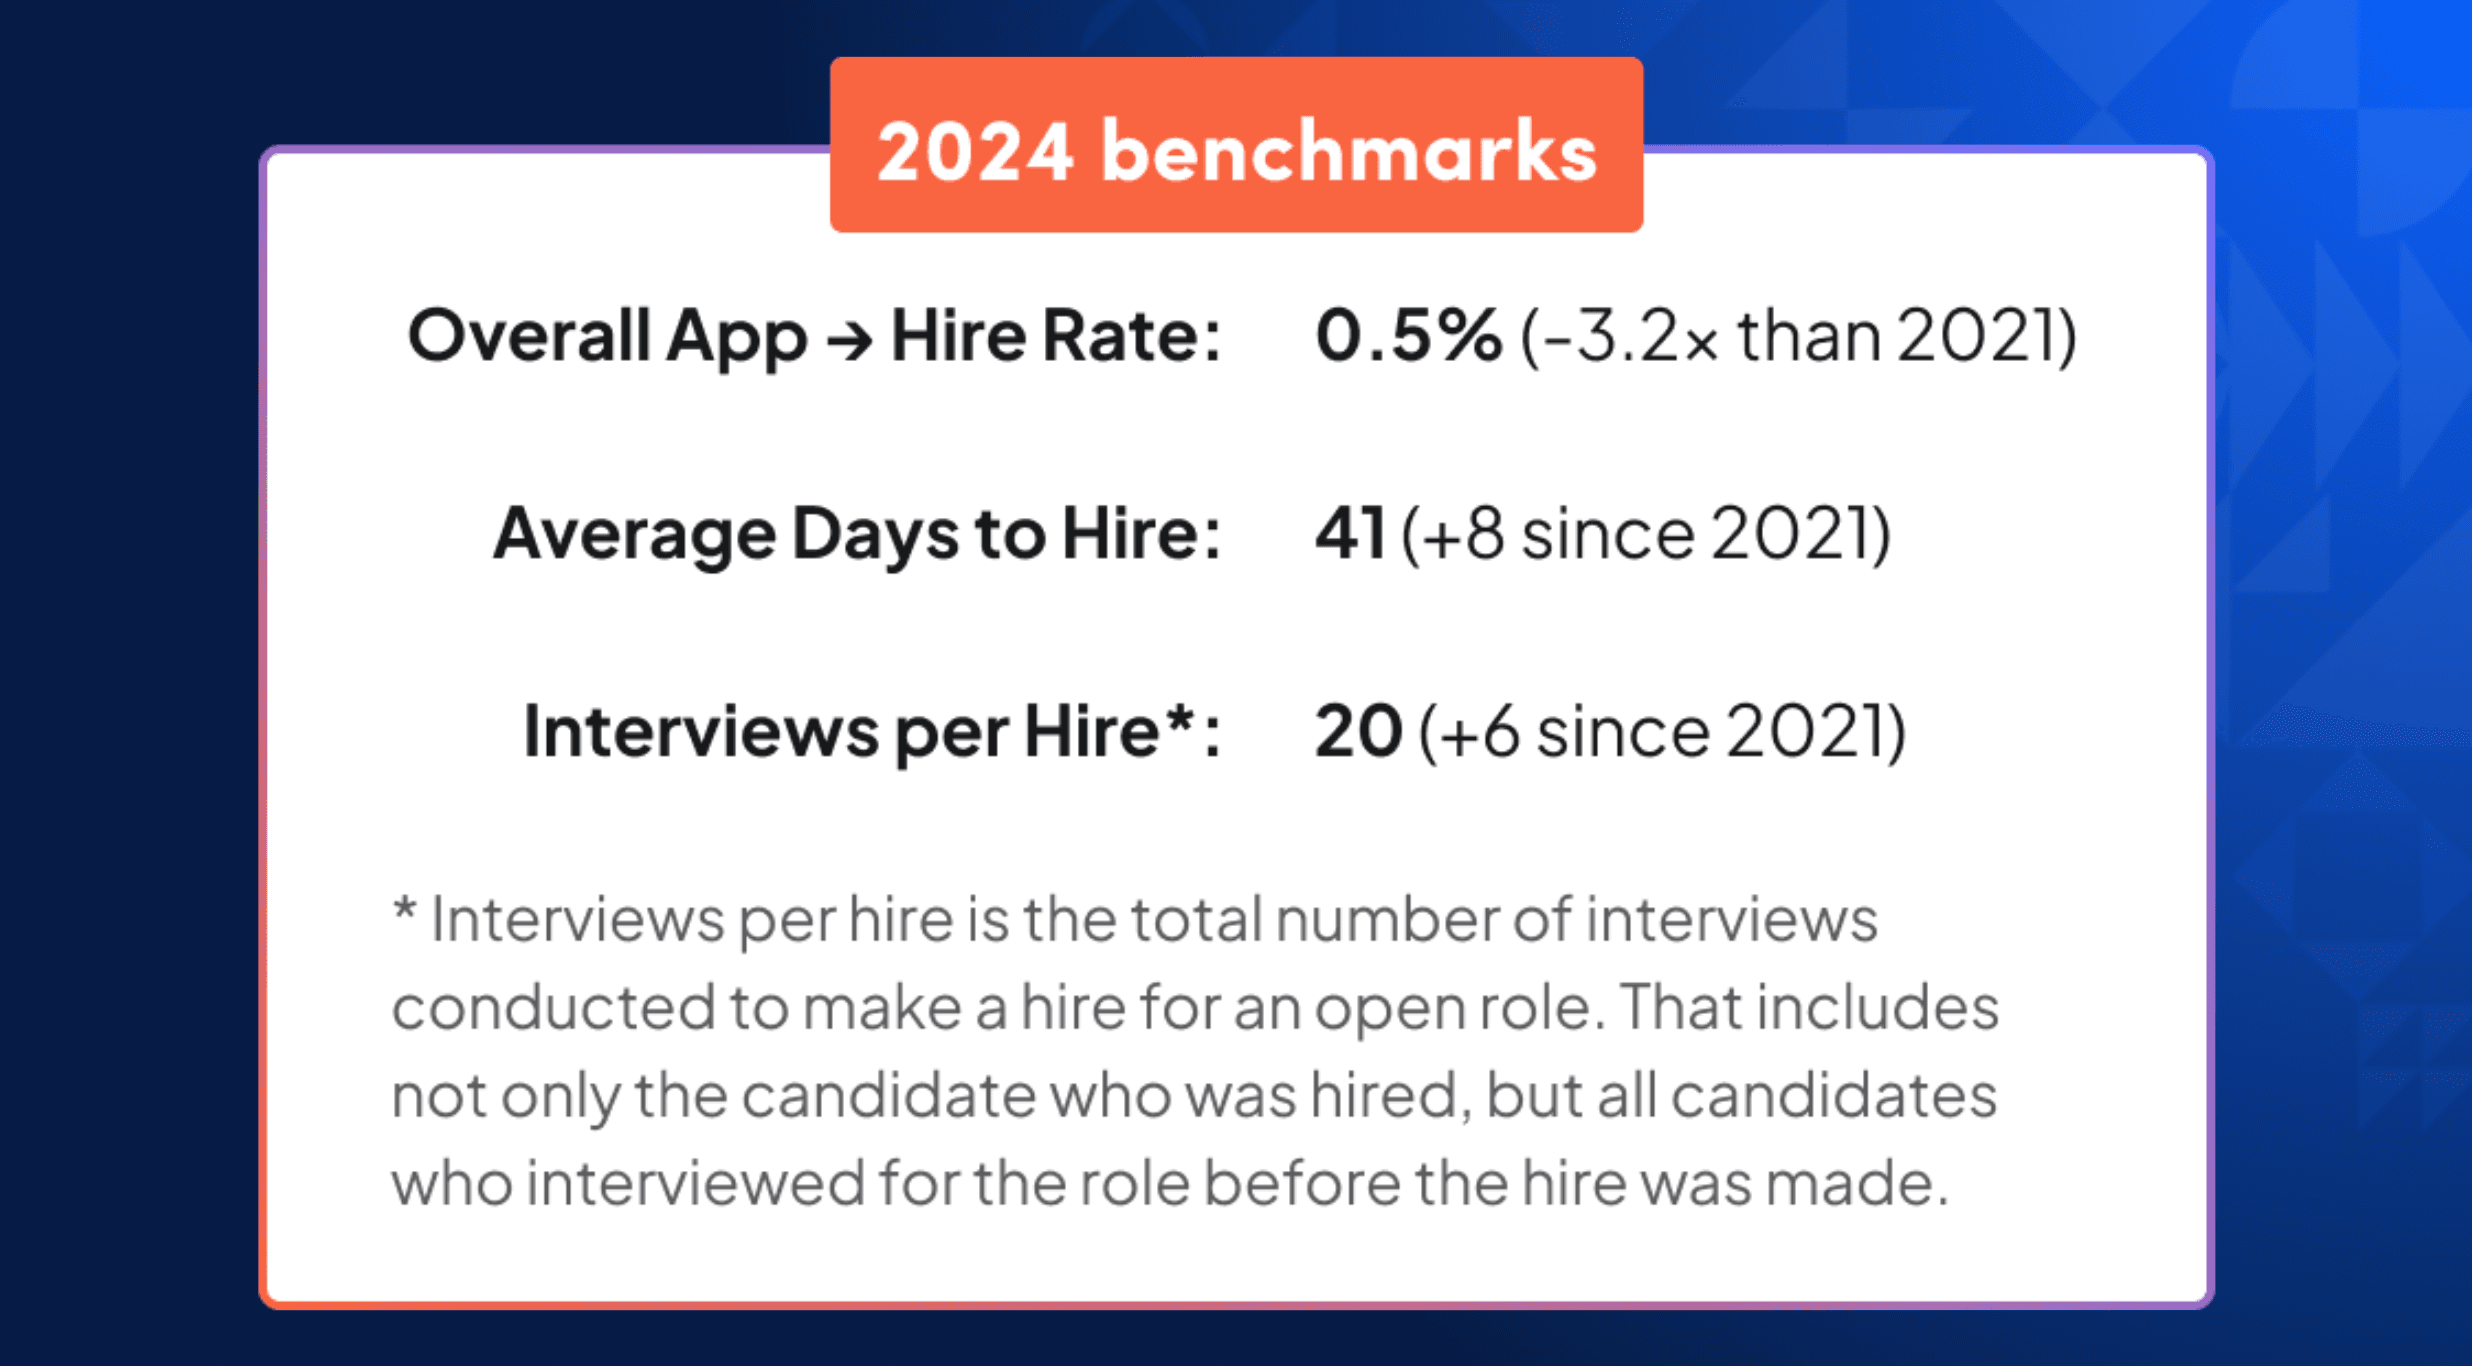
8. If you’re a candidate, getting hired is harder than ever.
Candidate passthrough rates are lower at every stage of the funnel. This is not surprising, given that the number of applications has outgrown the number of job openings. In short, a prospective applicant is 3× less likely to get hired for a role today than three years ago. This trend highlights the need for recruiters to refine screening processes and prioritize quality over quantity when evaluating candidates.
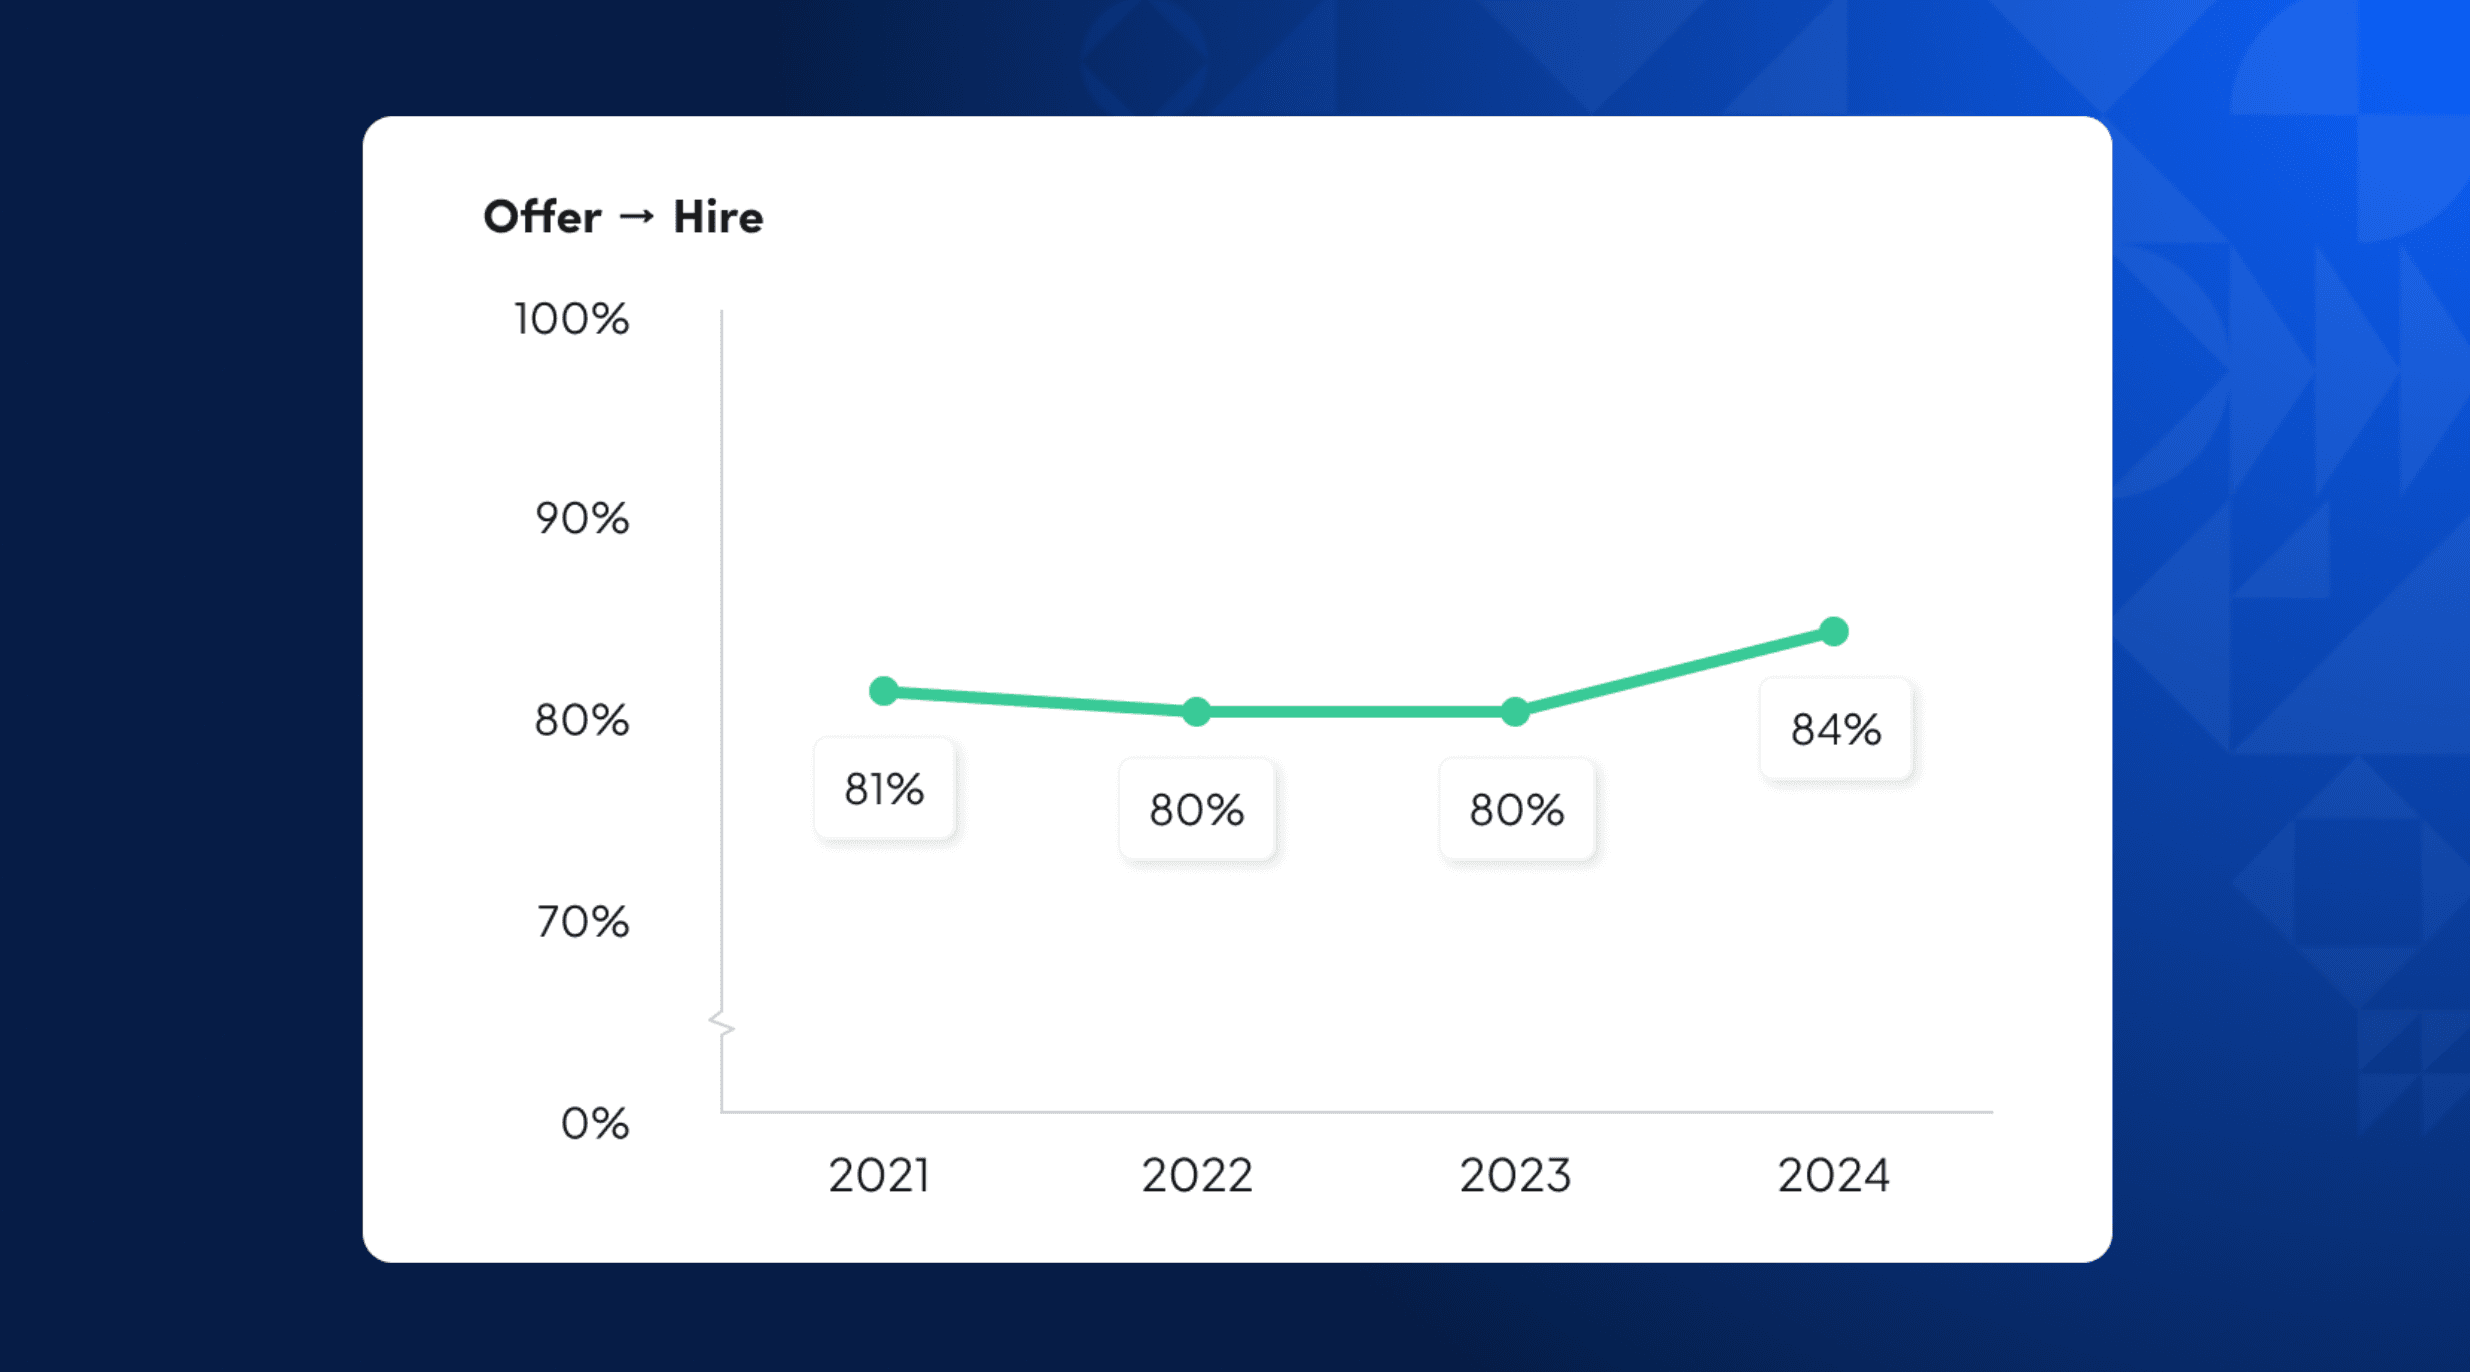
9. Offer-acceptance rates are on the rise, hinting at a shift in attitudes.
Candidates are now slightly more likely to accept job offers (84%) than they were during the pandemic and the Great Resignation (81% in 2021), signaling a shift in candidate behavior and increased willingness to commit to new opportunities. This shift suggests that candidates are becoming more confident in the stability of the job market and are more selective in considering long-term career growth.
10. Mixed results in diversity hiring highlight ongoing opportunities.
While women face lower passthrough rates at the top of the funnel, they see higher success in later stages and are more likely to receive offers. Disparities across racial and ethnic groups are more nuanced. Conversion rates across all groups have dropped in recent years, but considerable variability depends on the industry, department, etc. This underscores the importance of addressing biases at different stages of the hiring process to ensure fair opportunities for all candidates.
Note: for detailed charts and data on candidate passthrough rates, download the full report!
Curious for more information beyond these takeaways? Download “The 2026 Recruiting Benchmarks Report” here.
Share


Your resource for all-things recruiting
Looking for the latest data, insights, and best practices? Welcome to the Gem blog. We've got you covered.